Data Wrangling
Reliable pipelines, schema validation, and scalable transformations that keep downstream analytics honest.
We turn raw data into confident decisions. Trusted pipelines, geospatial intelligence, and decision-ready products — built to last.
Years applied experience
Pipelines & apps shipped
Reproducible, documented
Ingest, model, visualize

Four pillars that turn noisy, scattered information into decisions your team can defend.
Reliable pipelines, schema validation, and scalable transformations that keep downstream analytics honest.
Reproducible analysis, hypothesis testing, and statistical models that move the KPIs leadership actually watches.
From TIGER roads to wildfire risk — we build spatial workflows in Earth Engine, ArcGIS, and Mapbox that answer where and why.
Dashboards, Shiny apps, Quarto reports, and publication-ready charts that make complex findings feel obvious.
Before and after for every move — and an interactive map to explore.
| id | gender | age | weight |
|---|---|---|---|
| NA | "female" | "twenty-two" | NA |
| 34 | "M" | 34 | 78.2 |
| 999 | "male" | -7 | NA |
| 29 | "female" | 29 | 65.1 |
| NA | "male" | 41 | 9999 |
| 51 | "female" | 51 | 72.4 |
| -1 | "FEMALE" | NA | 61.8 |
| 38 | "male" | 38 | NA |
| id | sex | age | weight | |
|---|---|---|---|---|
| 42 | F | 22 | 68.4 | imputed |
| 34 | M | 34 | 78.2 | |
| — | — | — | — | dropped · outlier |
| 29 | F | 29 | 65.1 | |
| 42 | M | 41 | — | dropped · outlier |
| 51 | F | 51 | 72.4 | |
| — | F | 46 | 61.8 | imputed |
| 38 | M | 38 | 68.4 | imputed |
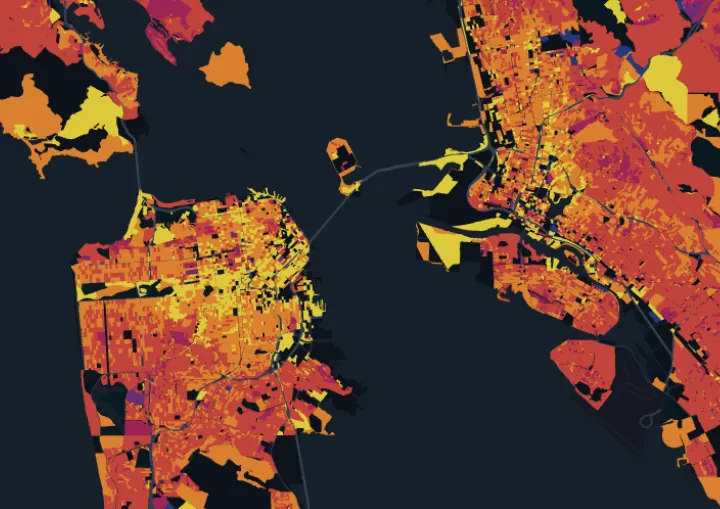
Choropleth products reveal dense coastal corridors invisible in spreadsheets or summary tables.
3-D terrain views make ridgelines, watersheds, and access constraints legible to every stakeholder.
Building extrusions place density in context — every tower a data point, every block an analysis unit.
and so much more.
Interactive apps, open geospatial datasets, and reproducible analyses — live and in the wild.
An accessible Shiny app for wrangling, analyzing, and visualizing tabular data — drop in a CSV, ship a chart. (opens in a new tab)
Simple GIS environment built for non-GIS users who still need strong map interaction and layer-based exploration. (opens in a new tab)
Gallery of interactive maps for ecoregions, counties, and other spatial layers designed for exploratory browsing. (opens in a new tab)
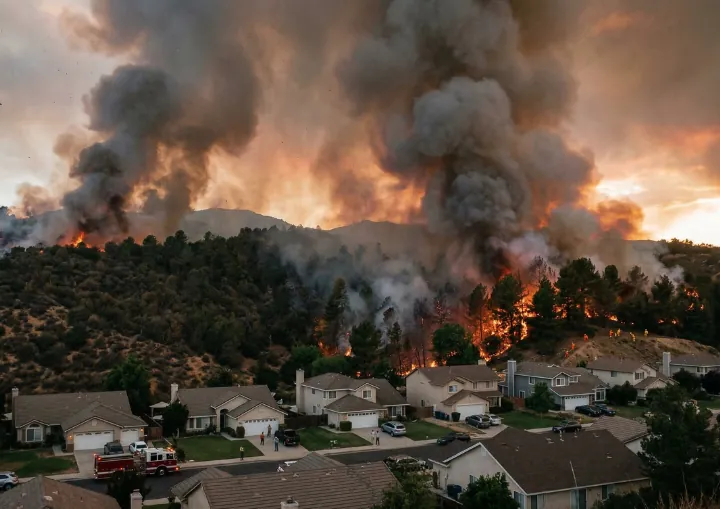
An interactive analysis of wildfire risk in the wildland-urban interface — suppression cost, structural damage, fatalities. (opens in a new tab)
Processed the US Census TIGER road network and published it to the Google Earth Engine community catalog for open, planetary-scale analysis. (opens in a new tab)
Map-first app for exploring wildfire risk dynamics at the wildland-urban interface across regions and seasons. (opens in a new tab)
The technical stack, organized by domain.
Not a consultant who hands you a slide deck — an operator who hands you the pipeline, the repo, and the docs.
We don't just crunch numbers — we translate them into the two or three sentences an executive needs to make the call.
Every analysis lands as a versioned repo: locked dependencies, tested functions, and a README your team can run from a cold start.
Planet-scale raster, national vector, urban analytics — we've shipped against all of them and published open datasets to prove it.
We scope, communicate, unblock quickly, and surface tradeoffs early. You get a teammate, not another ticket in your queue.
Spatialitix is led by Noah Weidig, Founder of Spatialitix and geospatial data expert, helping organizations turn complex data into confident decisions.
Noah combines statistical rigor, spatial reasoning, and production-grade delivery so teams can trust every output, map, and recommendation.
One email. Plain English. We'll tell you whether we're the right fit — and if we're not, who is.